One of the key aspects of web site optimization is analysis of your site traffic. This google analytics seo course for dummies will talk about the most used and simple reports available in the console.
As a seo beginner, you would like to check the organic traffic of your site with ease. At the same time there are different metrics like average amount of time spent by a visitor on an article, number of returning visitors, geographical sources of your visitors, demographics, number of pages visited in a single session etc.
Small businesses use analytical tools supplied by the host. But they are not intuitive like Google Analytics tool. It is provided free of cost. Initially this was developed with an intention to support ecommerce sites. But later it was made available to all Google account users.
Related
- Google Adsense Account – Complete Guide for Beginners about Reports
- How to Increase Adsense Page RPM to $10 in 2020
The following advanced Google guides help you to better understand your site analytics and improve SEO of the site.
You can get detailed reports of your campaigns and ad budget spends from this tool. In this web analytics tutorial of Google Analytics study guide, we are going to see how to access the following reports.
Mastering SEO with Google Analytics: A Comprehensive Course
If you’re looking to elevate your SEO skills and harness the power of data-driven insights, the Google Analytics SEO course is a must-take. This comprehensive course is designed to help you understand how to effectively use Google Analytics to optimize your website’s search engine performance and improve your overall online presence.
Throughout the course, you’ll learn how to set up and configure Google Analytics, interpret key metrics, and use the platform’s advanced features to gain valuable insights into your website’s traffic, user behavior, and conversion rates. You’ll discover how to track and analyze your organic search performance, identify high-performing content, and make data-driven decisions to enhance your SEO strategy.
The Google Analytics SEO course covers a wide range of topics, including setting up goals and funnels, segmenting your audience, and using custom reports to dive deeper into your data. You’ll also learn how to integrate Google Analytics with other SEO tools, such as Google Search Console, to gain a holistic view of your website’s performance and identify opportunities for improvement.
By completing this course, you’ll gain the skills and knowledge needed to leverage Google Analytics effectively for SEO purposes. Whether you’re a beginner or an experienced marketer looking to refine your skills, the Google Analytics SEO course provides a comprehensive foundation for success in the ever-evolving world of search engine optimization.
How to Access Google Analytics (GA) Dashboard
This is very simple. The following steps will summarize the process.
- Create a Google or Gmail account.
- Use this link to login to Google Analytics – https://analytics.google.com
- Sign up using the Google account.
- You need to provide Account Name.
- Choose the recommended data sharing options for better control of sharing of Google Analytics data.
- Select one of Web, Apps, Apps & Web to measure data analytics.
- Enter a website name (if you chose Web).
- Enter the Website URL.
- Select Industry Category and Reporting Time Zone.
- Create a Property and View for your site.
- Google Analytics account is created for your first site.
- Then go to your site in Google Analytics Dashboard and click Admin (gear icon) at the bottom.
- Under your Property, you can get “Tracking code”.
- Add that to your site.
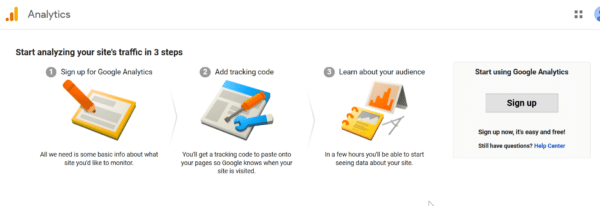
Now your site is ready to see web analytics data of your site in a few hours.
How to View Realtime Traffic Data in Google Analytics
Report #1: Home >Reports > Realtime
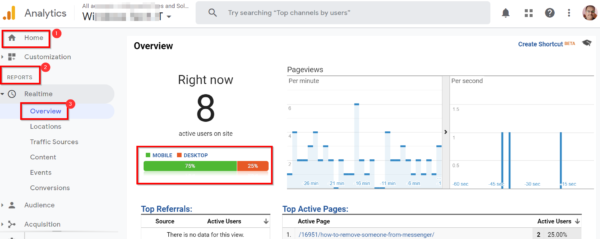
For some data analytical tools, it may take up some time to show the current visitor profile data. But in GA, we have “Realtime” feature. The Overview tab will show –
- Number of active users on the site
- Color indication of desktop, mobile and tablet traffic, top active pages, top locations.
- You can also get details about traffic sources, landing pages, events and conversions live.
This is useful if you see any unusual spike or decrease in traffic. You can initiate immediate remedial actions if there are any changes in the visitor traffic.
How to View Age and Gender Data in Google Analytics
Report #2: Home > Reports > Audience > Demographics
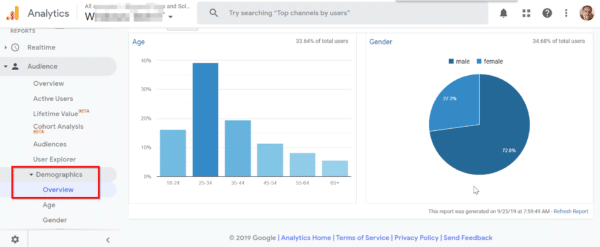
This report is useful if you want to know the majority of age group visiting your website. You can get an idea of the number of teenagers, millennials, senior people visiting your site. Based on this information you can set your conversion campaigns and targets. Also if more of females are visiting your site, you can write content relevant to them.
How to View Country Data of your Visitors
Report #3: Home > Reports > Audience > Geo > Location
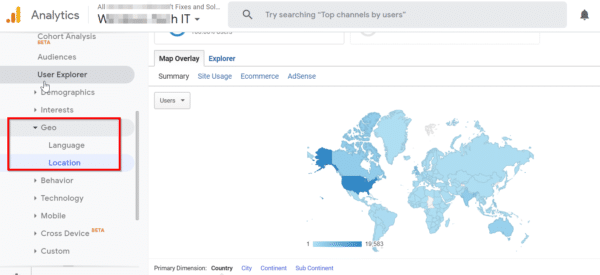
If you want to find out the country from which majority of your visitors are seeing your site, the report display is available at the above location. This gives a fair indication of location specific data which is useful in targeting your Facebook campaigns, Twitter and LinkedIn ads.
Also, you can place Google Ads campaign to the right targeted traffic, based on this report.
How to View Device Data in Google Analytics
Home > Reports > Audience > Mobile
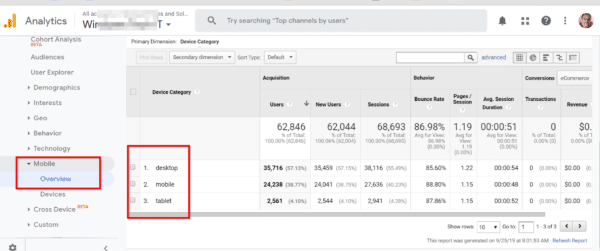
When you click the overview tab, you can see the amount of traffic you get from desktop, mobile and tablet. This is useful if you want to know what kind of devices are being used by your visitors. Appropriately you can change content on your site.
If you are getting more traffic from desktop, then you can adjust the theme and layout to suit that device needs. On the other side, if mobile traffic is more than you can write content related to apps or make your theme responsive. This will make sure that user clicks on the sale signups or conversion channel leads.
Also, you can place ads properly to suit your device category.
How to View Data for Organic Traffic in Google Analytics
Home > Reports > Acquisition > All Traffic > Channels

This is a very important feature of site traffic analytical tool. You want more visitors from search engines for better conversions of your affiliate products. But if you are getting traffic from social media, it indicates that your blog posts are shared by audience on various platforms like Twitter, Facebook, LinkedIn, Reddit, Whatsapp.
Based on your needs, you can optimize your content for default channel grouping. So if you want more shares or tweets, then you can write a good summary to post on the social media. But if the need is to get organic traffic, then you better concentrate on on-site and off-site seo optimization, to rank higher for your keywords.
To learn more about SEO metrics of your site, you need a marketing tool like SEMrush. These tutorials are basic guides for SEO beginners and help improve your organic traffic.
If you want more direct traffic, then you can comment on different posts in your niche.
How to View Number of Page Views for Your Posts
Home > Reports > Behavior > Behavior Flow > Site Content > All Pages
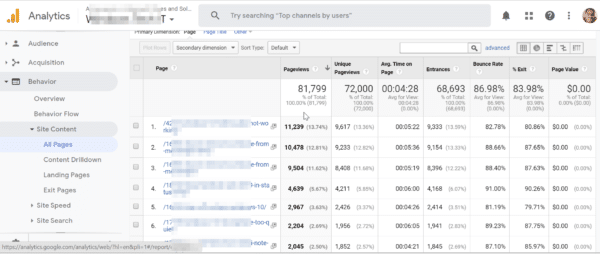
This report will show all your articles and its seo metric. Some of the important data from this page are number of page views, unique pageviews, avg. time on page, entrances, bounce rate, %exit and page value.
From this report, you can find the top pages that are generating traffic. Then using search console you can optimize your remaining pages, to improve traffic. You can also find the sources from which you are getting traffic for a particular post.
Also you can analyze whether the dwell time for your post time is high or low. Then you can make necessary changes so that it remains high. Also if your bounce rate is more than 90%, it indicates that users are leaving your site quickly. This is detrimental for your sales channel funnel.
Then you can include links, images, videos, text to engage audience in a better way.
How to View Page Loading Speed of your Site Posts
Home > Reports > Behavior > Site Speed > Page Timings
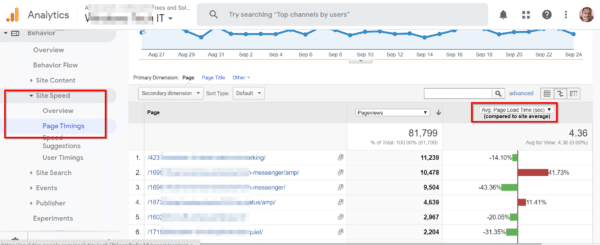
As we know site loading speed is an important signal as a ranking factor in Google. So if your pages are quick enough, then you will get better organic traffic. Instead of checking each page in a speed analysis tool, Google Analytics automatically checks your pages for speed and reports the time taken for them to load.
If the avg. page load time is high, then you have to optimize your CSS, JS, HTML to reduce the load on your server. Otherwise, you can do page optimizations or decrease the number of WordPress plugins to improve your site speed. You can see a red or green indicator to see if your page speed is above or below the site speed threshold.
How to view Google Adsense revenue for each of your Pages
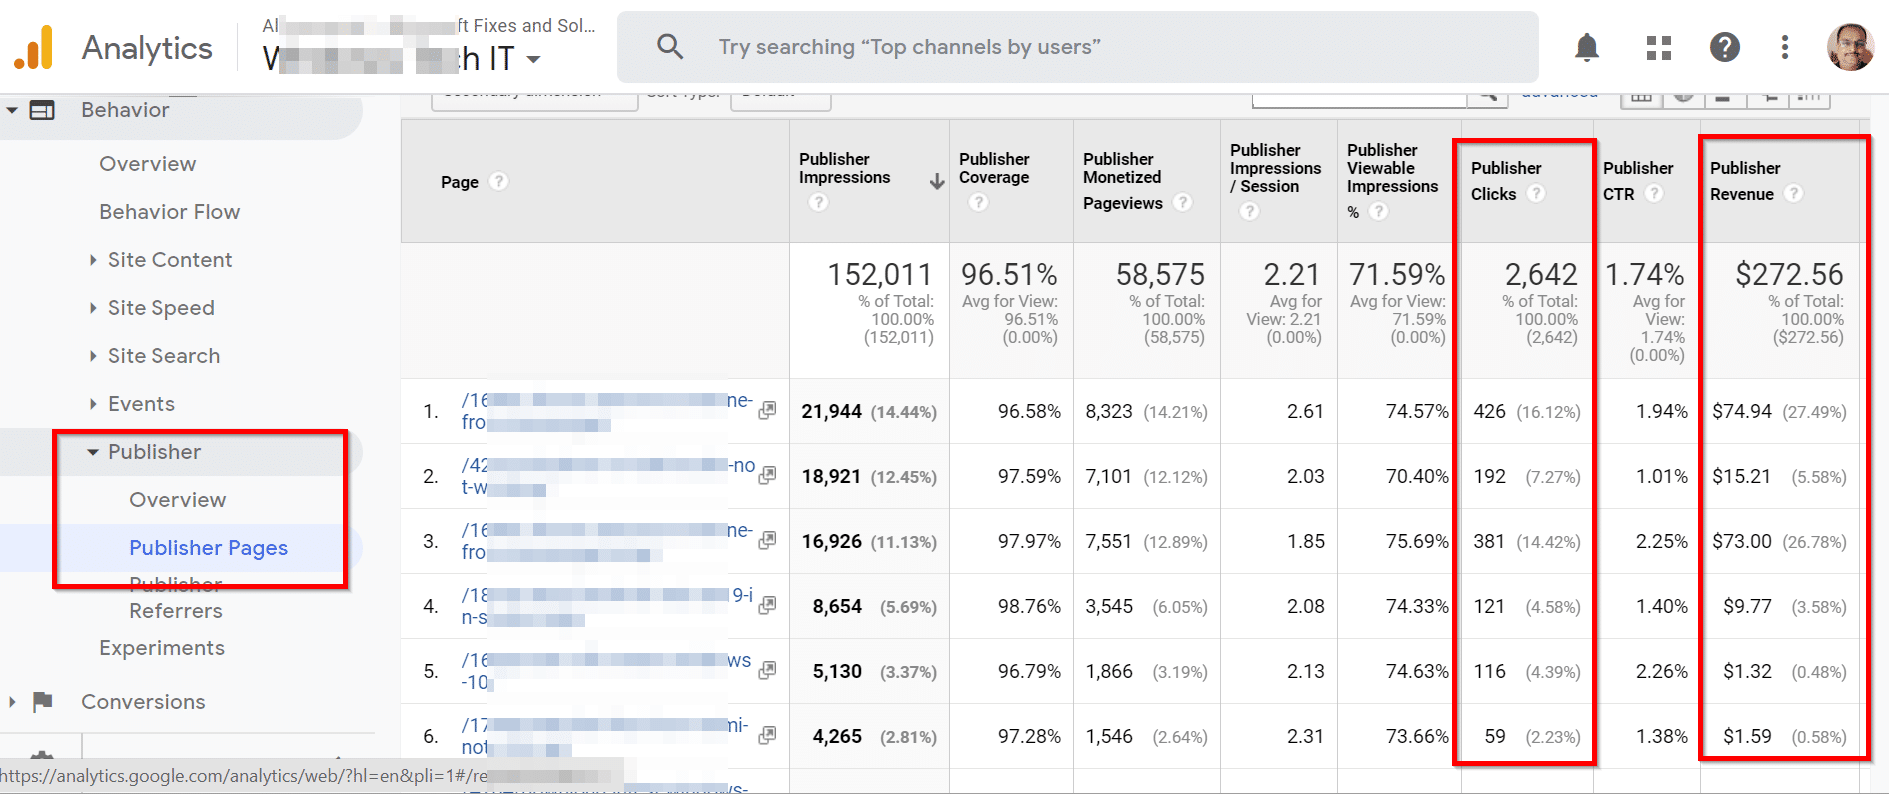
Home > Reports > Behavior > Publisher > Publisher Pages
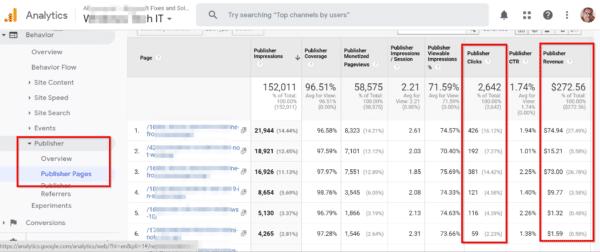
This report is useful if you want to know how much earnings you are getting from Adsense from each page. Generally, if your traffic is high from countries like US, UK, Canada, Australia etc to your site pages, then your ad revenue will also be more.
But on the contrary, if you see low CPC and high traffic to those pages, it indicates wrong placement of Google Adsense ads. Then you can change the ad size or position to make users click on your ads. You can see important metric data like clicks and revenue from this report for each page.
Google Analytics SEO Course – Summary
The above reports are useful to an average webmaster or SEO beginner. You can get more in-depth data by adding dimensions and filters to your reports. You can run experiments like A/B split testing to see which pages are working and observe the generated data. You can also make changes to your analytics code to make use of Google Tag manager.
But the above reports are the basic ones. These are sufficient to know how your site is performing in search engines and social media. Then you can take appropriate action to improve your site speed, traffic and conversions.
How to View Basic Reports in Google Analytics Dashboard – Summary
Total Time: 10 minutes
Real Time Traffic Data
This report will show the current traffic coming to your site from mobile, desktop and tablets. 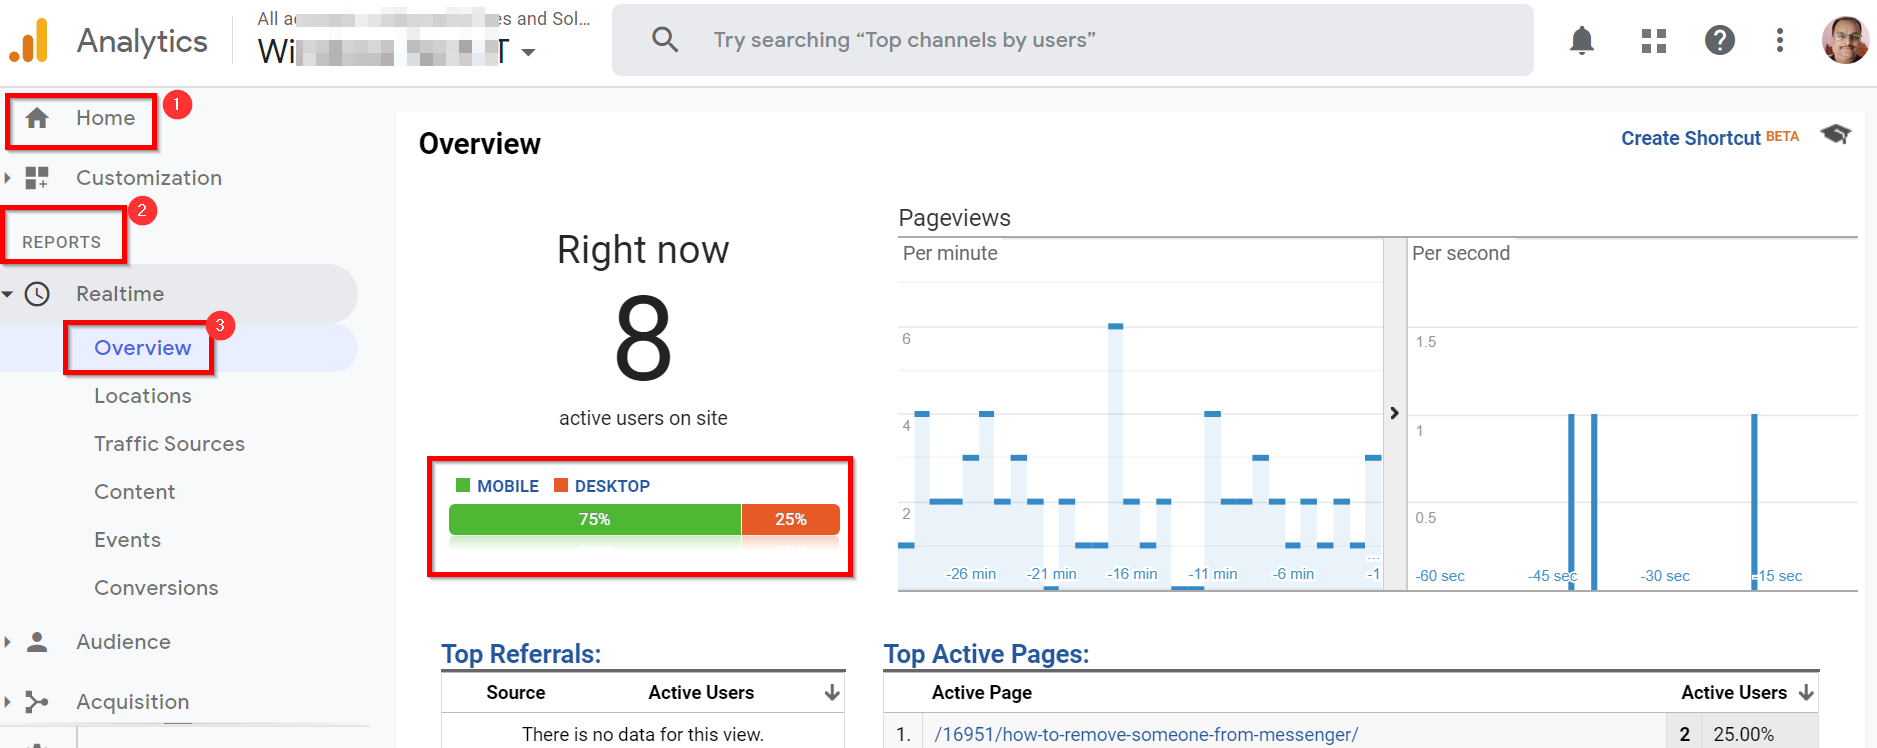
Demographic Data
This report will show the age group and gender profile of your visitors over a set time period or daily or monthly.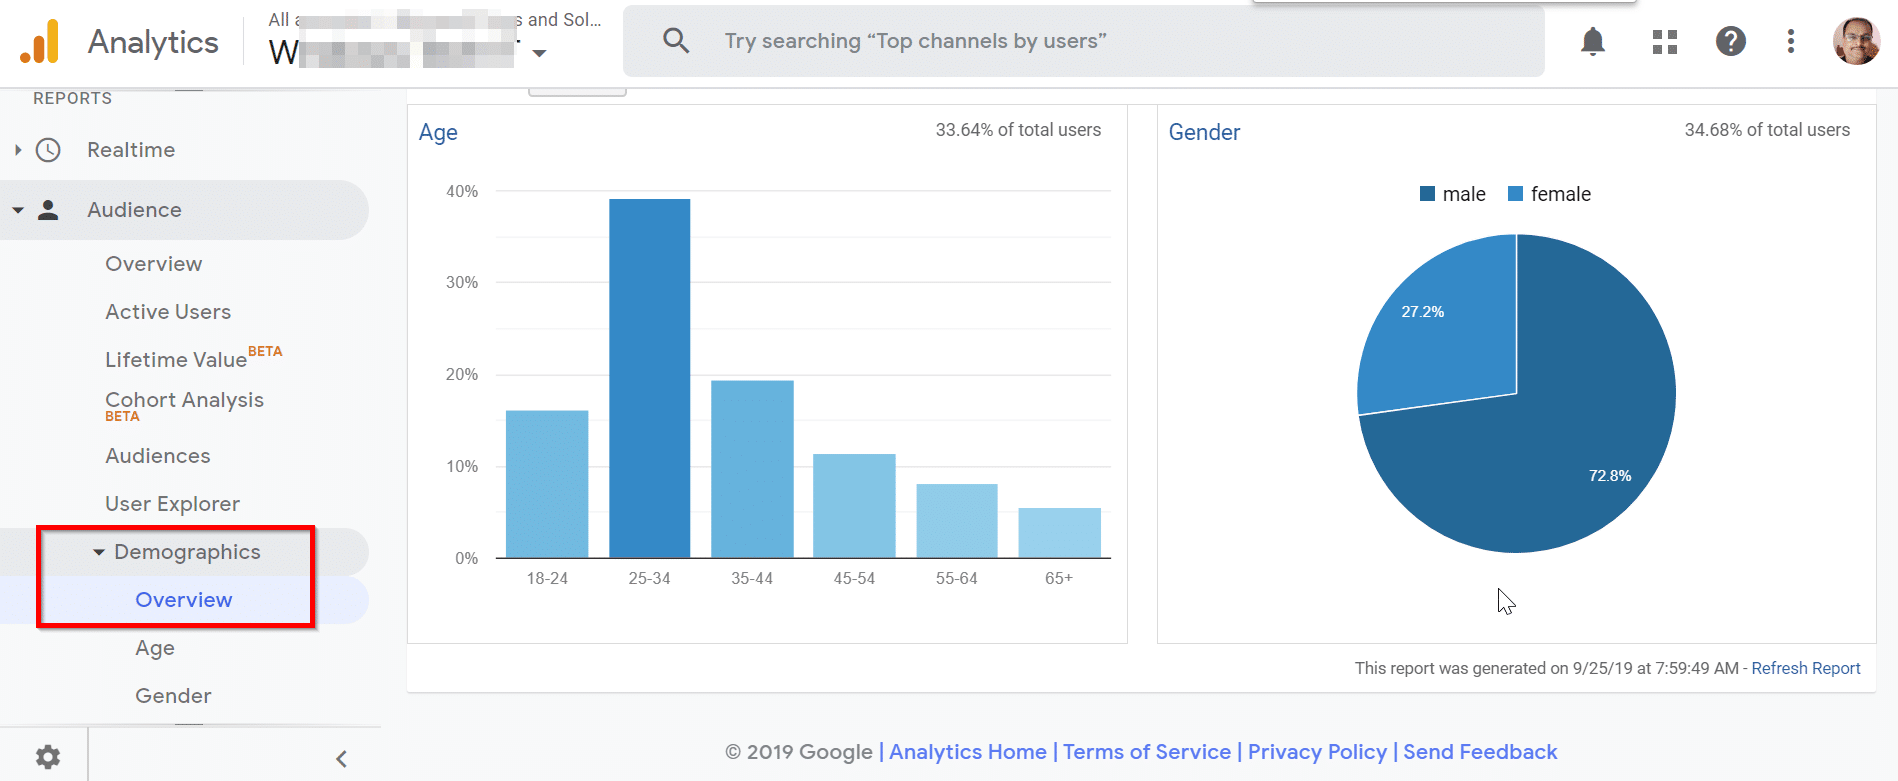
Country and City Specific Data
This report will show information about country and city specific data of your visitors. 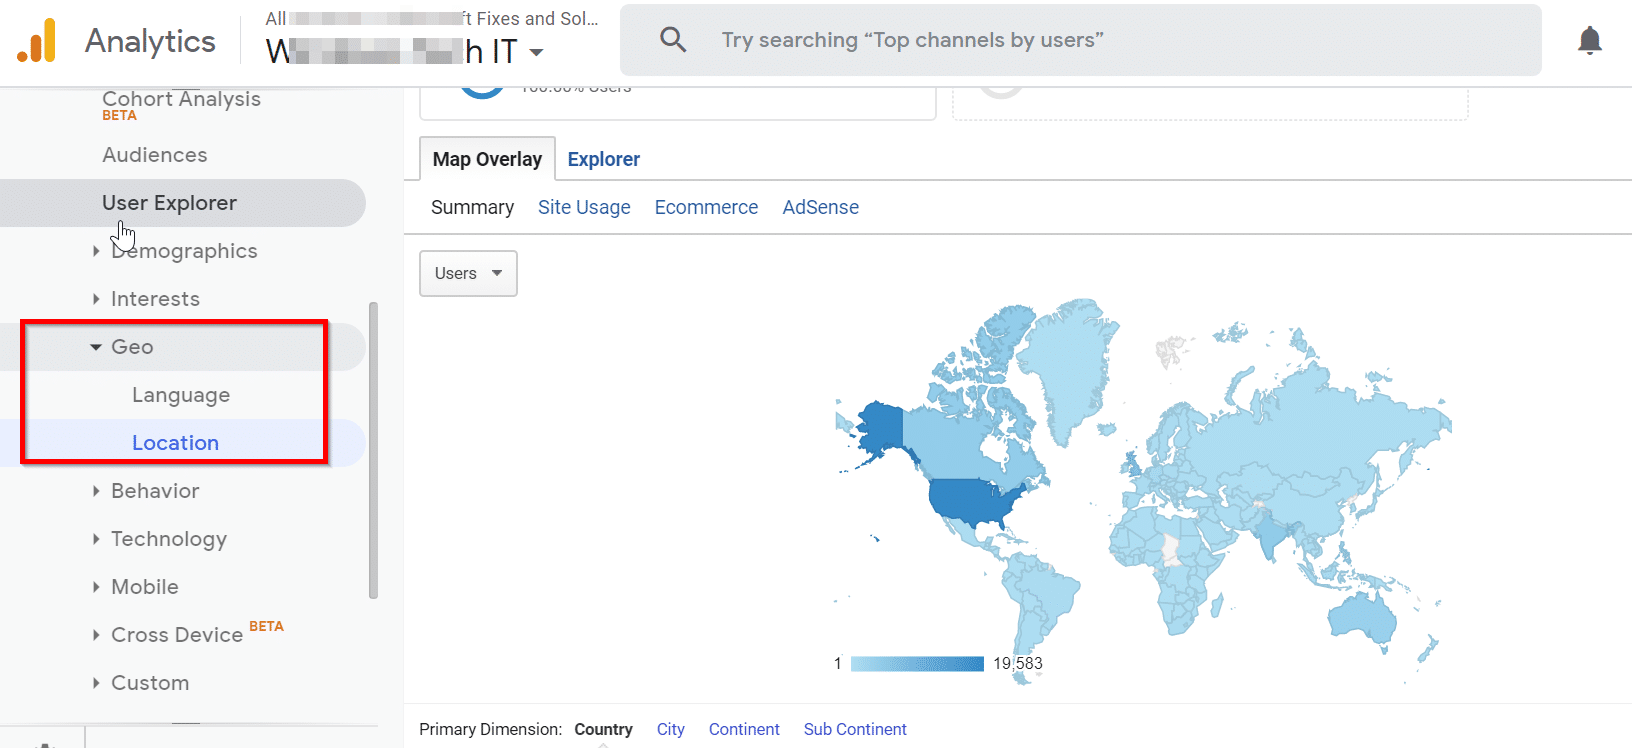
Device Category Data
This report will show information about the devices your audience are using to visit your website. 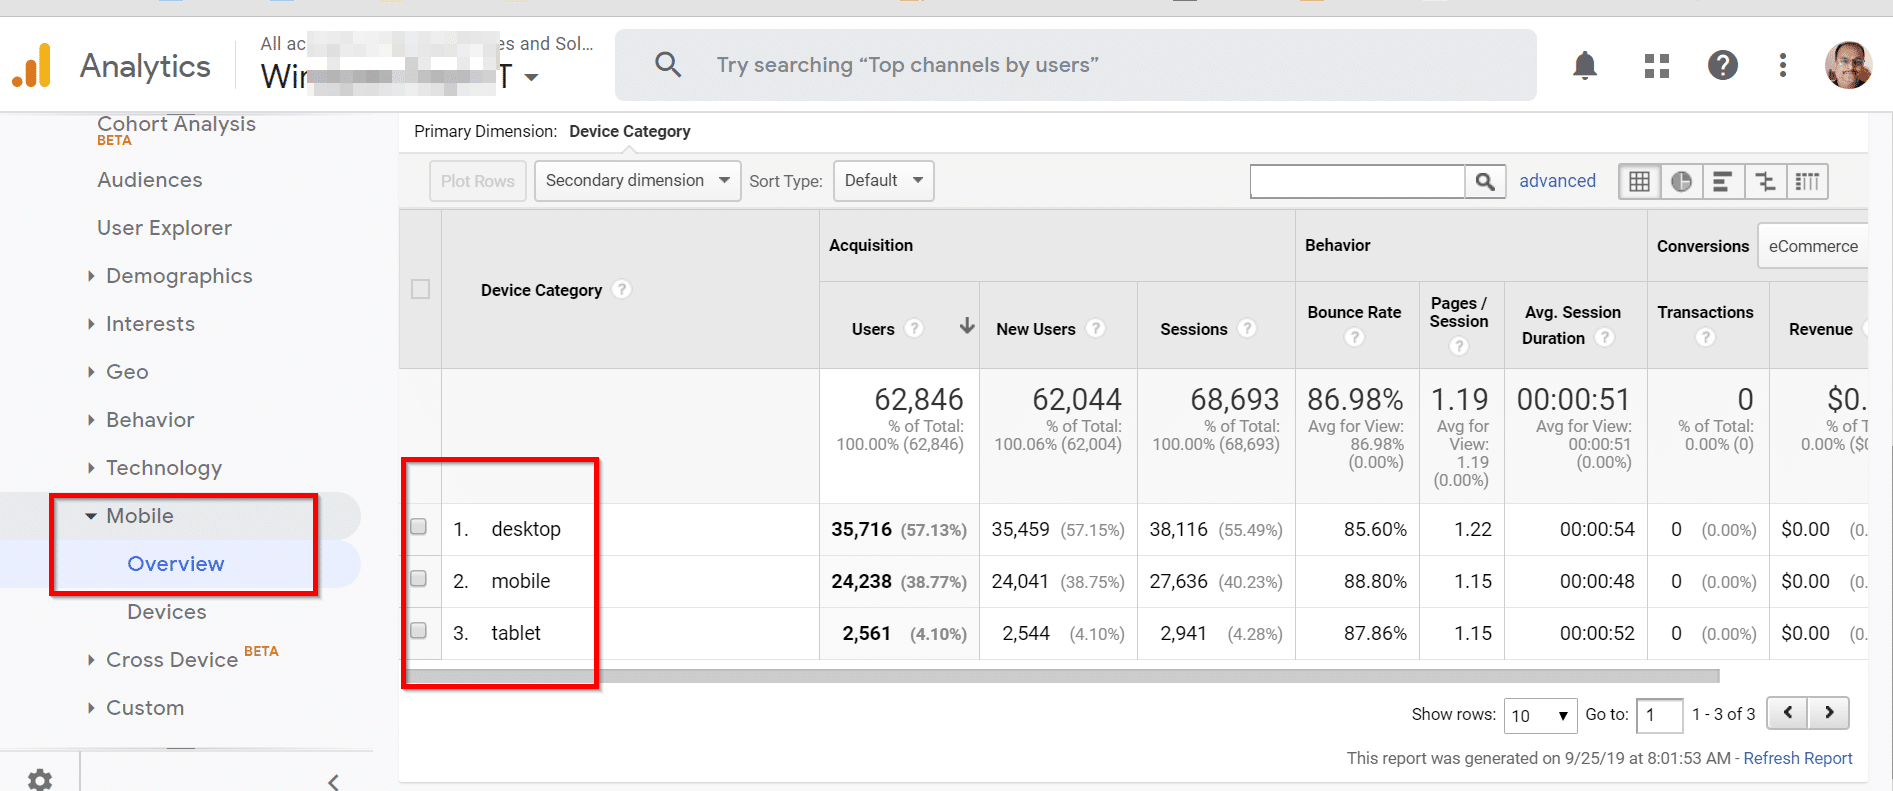
Channel Traffic Data
This report will show the type of sources for your traffic which includes organic, direct, social, reference etc.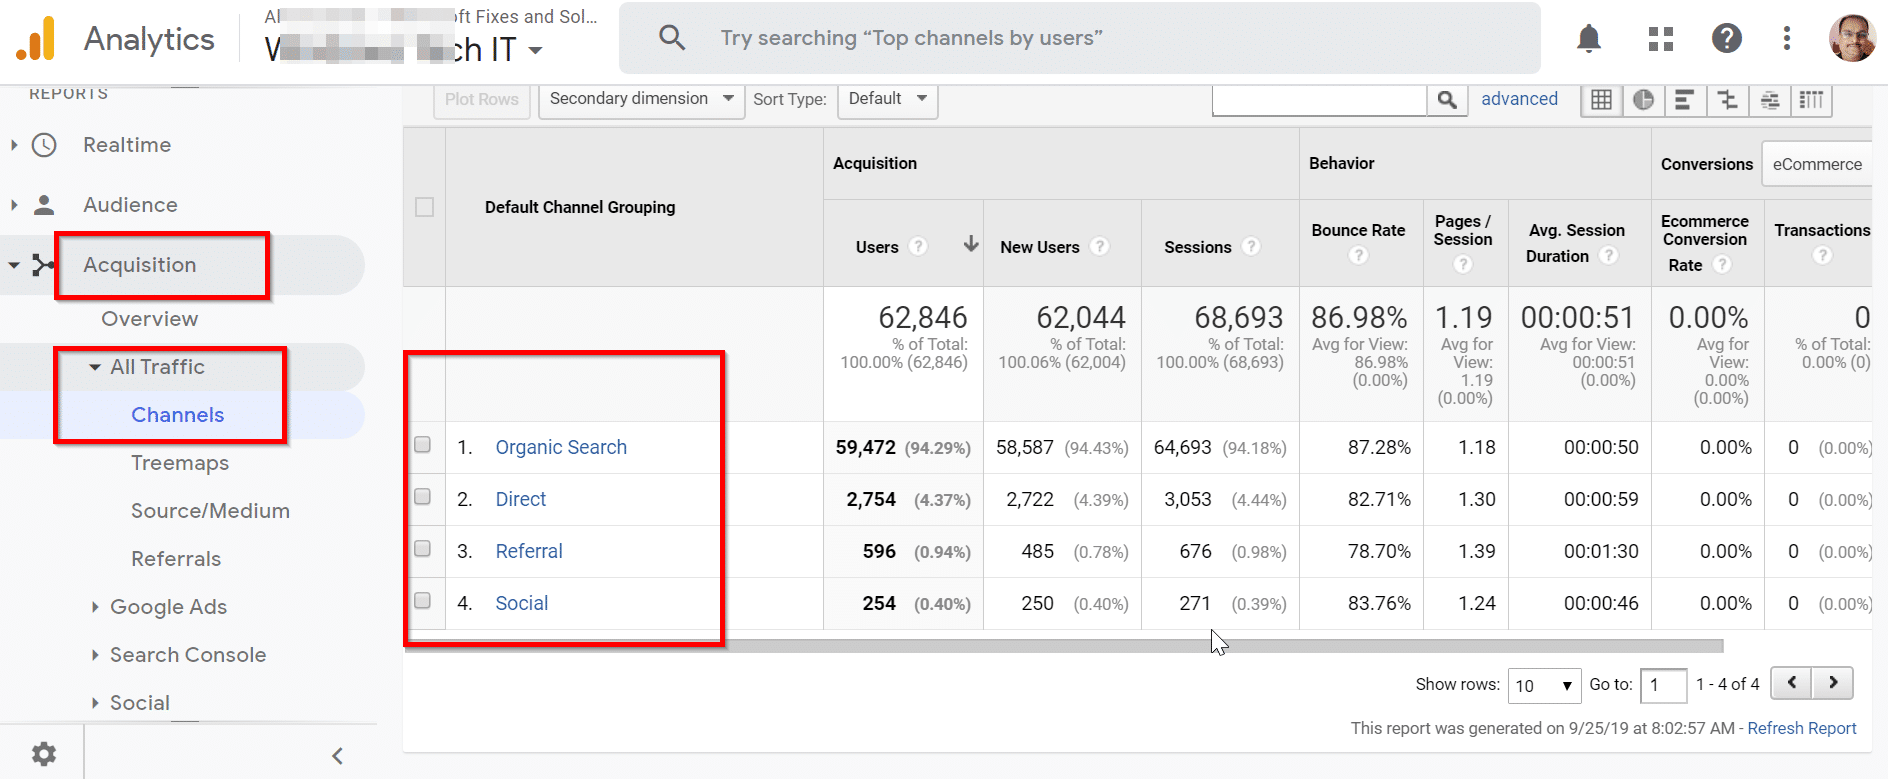
Page Views Data
This report will show the amount of page views and other seo metrics for all of your web pages receiving traffic on your site.
Page Speed Data
This report will show the average page loading timings of most important pages of your site. 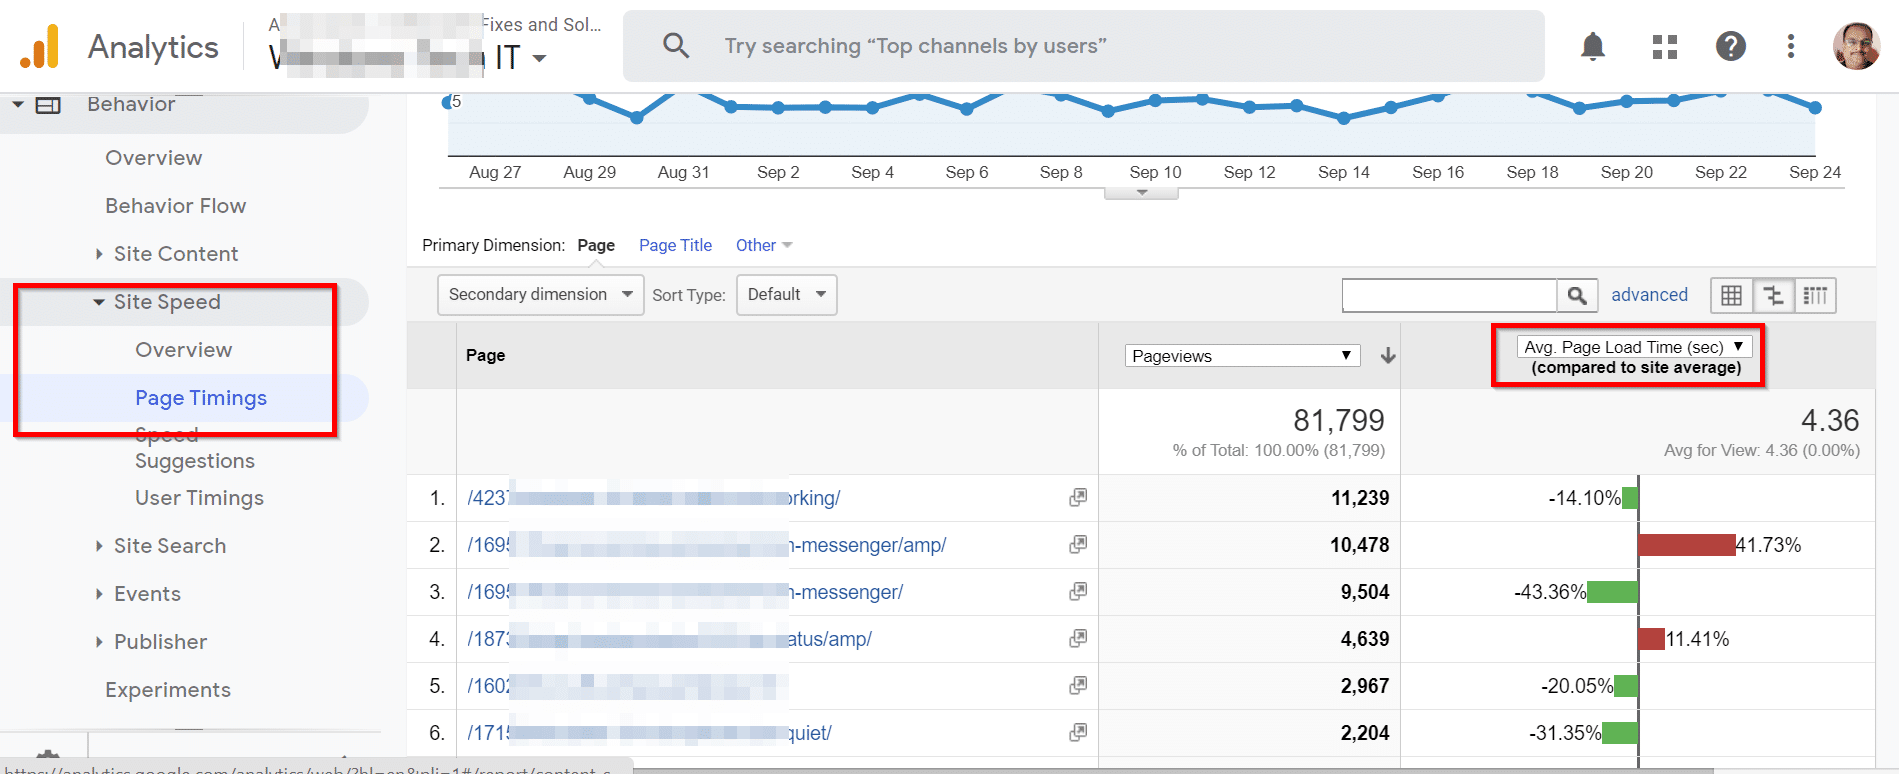
Publisher Revenue
This report will show data and metrics about most revenue generating pages on your site through channels like Google Adsense. 