The counterpart of Google Analytics (GA), which is helpful to many webmasters, the Google Search Console (GSC) has got a new interface. The main purpose of analytical tools is to display data, to take the right decisions. In-before Dec 2018, we had an old interface, where we had to click more to get the analytical data.
Now in post-Dec 13th 2018 and in future 2019, you have a stylish new interface of Google Search Console. This is less time consuming and easily understandable with colourful display. You can superimpose several features on the same. Another thing is you can shift from one report to another with easy, instead of going forward and back.
What is Google Search Console
According to this priority page of Google,
https://support.google.com/webmasters/answer/4559176?hl=en
Google Search Console is a free service offered by Google that helps you monitor and maintain your site’s presence in Google Search results. You don’t have to sign up for Search Console for your site to be included in Google’s search results, but doing so can help you understand how Google views your site and optimize its performance in search results.
In simple words, if you want to know the search queries (or for that matter the “keywords”) which your site visitors are using to reach your site, those details can be got from Search Console. This is the main purpose of the tool.
You will be able to better understand how your site is performing in Google search results. Bing also has a typical kind of analytical tool, which we will discuss in another post.
Previously known as Google WebMaster Tools, it is now called Google Search Console. There are so many important SEO metrics which one could gather from this tool. Earlier in Google Analytics (GA) tool, we are able to see the keywords for which we are ranking and the visitors are using them.
But Google has closed that option lot earlier back and now we can see the “search queries” under Acquisition tab in Google Analytics , when GA and GSC are linked up. But there will be some difference between the two reports.
What is the new Google Search Console and how to use it
In this new interface, we have the following tabs on the left-hand side.
- Overview
- Performance
- URL Inspection
Index
Coverage
Sitemaps
Enhancements
Mobile Usability
AMP
Manual actions
Links
Settings
Submit feedback
About new version
Go to the old version
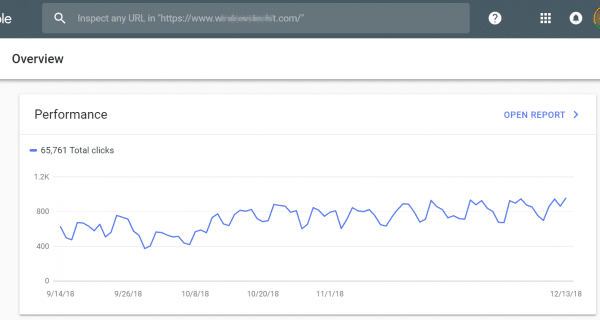
In the Overview tab, you can see the summary of performance, coverage and enhancements. The Perfomance panel will show a graph of the total clicks you had from search impressions, in the last 28 or 90 days. The coverage panel will show the validity of your pages, if there are any errors or not.
The Enhancements panel will show the mobile usability and AMP validation errors and trend.
Performance
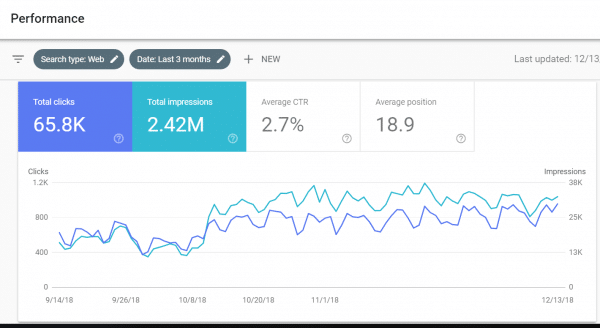
The is the most important analytical tab on the left-hand side. On the right-hand side, you can show a spectacular graph of the all the important visitor data in one go.
The difference between the old search console and the new one, is that, you have to click through several pages to see multiple SEO metric data. In the new search console, it is made easy to see all the visitor metric in different tabs.
The following tabs appear below the graph
1. Queries
2. Pages
3. Countries
4. Devices
5. Search Appearance
The graph will indicate the following metrics.
1.Total clicks
2. Total impressions
3. Average CTR
4. Average position
You can see beautiful color lines of all the 4 metrics in a single graph. If you want to separate out 1 or 2 metrics, you just have to click that particular metric option above the graph. If it is white, it will not show on the graph.
URL inspection
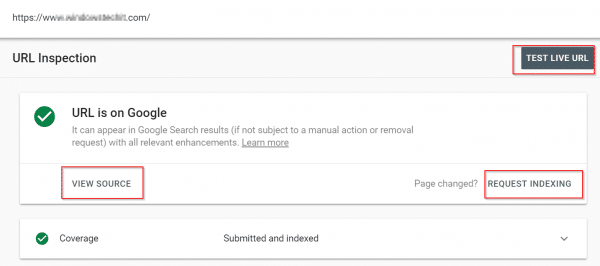
This is the substitute for the old “Fetch URL” tool. If you want to index or re-index any of your posts, you can do it here. If it shows a green tick mark, it indicates that the URL is on Google. The URL can appear in Google search results, if not subject to manual action or removal request.
Below that you can see the “Coverage” details which indicate the following.
Discovery
Sitemaps
Referring pages
- Crawl
- Last crawl
- Crawled as
- Crawled allowed?
- Page fetch
- Indexing
- Indexing allowed?
- User-defined canonical
- Googl-selected canonical
The canonical tag indicates the correct page if there are lot of duplicate pages with the same or similar content.
Coverage
This will show the following metrics
1. Error
2. Valid with warnings
3. Valid
4. Excluded
You can superimpose the Impressions metric with any or all of the above metrics. You can see the details of your errors and warnings. It will show when the error appeared and whether it has been rectified or not. You can take appropriate action after seeing the details.
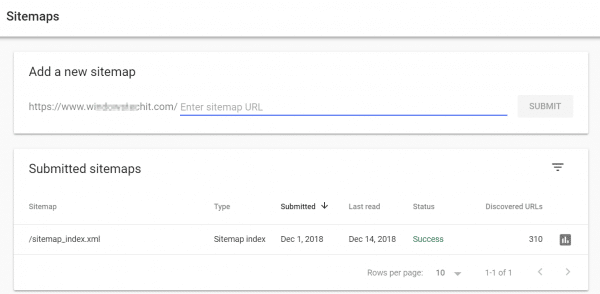
Sitemaps
This is where you can add a valid sitemap in .xml format. The submitted sitemaps will show the following.
1. Sitemap
2. Type – Sitemap index
3. Submitted date
4. Last read
5. Status – Success or Fail
6. Discovered URLs.
Mobile Usability
Here also you can see the same error and warning details. This is very important in the first-mobile indexing age of Google. Since it has made it important that Mobile is going to play a major role in search engine rankings, your site should be responsive.
If there are any errors related to crawling or indexing of mobile pages, it will be shown here.
AMP
It stands for Accelerated Mobile Pages. These are fast loading pages of mobile responsive pages. If you see a AMP icon in the search results, it shows that AMP pages are served to you by Google and the site.
As Mobile takes approximately 50 to 60% of searches these days, it becomes important, that your pages are AMP valid. Also the loading time of a page is an important ranking signal in Google search results.
So if your pages are AMP valid, then its good for higher search engine rankings and good organic traffic.
Manual actions
If you have done any negative SEO or other spam actions like link building unnaturally, Google may penalize you for some pages or for the whole domain. Sometimes Google will go through your site manually and impose some penalty. These actions can be seen here.
It is required to check from time to time to see if there are any manual actions. This will keep your site in good health in Google’s eyes.
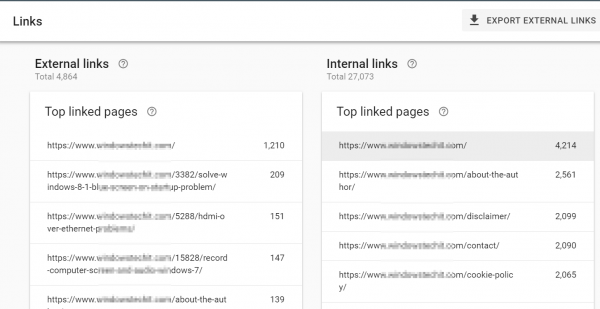
Links
This will show the following
1. External links
2. Internal links
3. Top linking sites
4. Top linked pages
A summary can be seen on the right-hand side page. If you click more for External links, you can see the Incoming links and Linking sites to your homepage and other posts.
As the number of domains pointing to your site is important, it is a good metric to follow. Then you can pep up your natural linking building efforts in order to build more links.
Settings
It will show the users access to Search Console and their permissions.
Submit feedback
This is the least ignored feature in Search Console. Many think that you cannot contact Google if there is any manual action or want to report to it. But this feature, which includes a screenshot, makes it possible to submit your grievances to Google.
Go to the old version
The last feature is where you can go back to the old interface.
Conclusion
In all, the new Search Console feature is rich in snippets and panels. There are few cluttering links on the left-hand side and it is a clean interface. The Performance tab can be used positively to up your rankings if you used in the proper way.
We will talk about it in a new post.
But the time going through the SEO details and visitor metrics of your site is shortened due to this new interface.
I really like the way the data is presented and have less headache finding your desired data and information. You can still export rows of data which contains impressions, clicks, click-through-rate and many others.

